|
|
|

Key Features
The experiment can be used with Oryx8 and Oryx4 with automatic oil dispensing. Oryx Nano also supports microbatch phase diagrams, but oil must be added manually. Therefore larger drop volumes (greater than 1.5 μl) are recommended to minimise evaporation.
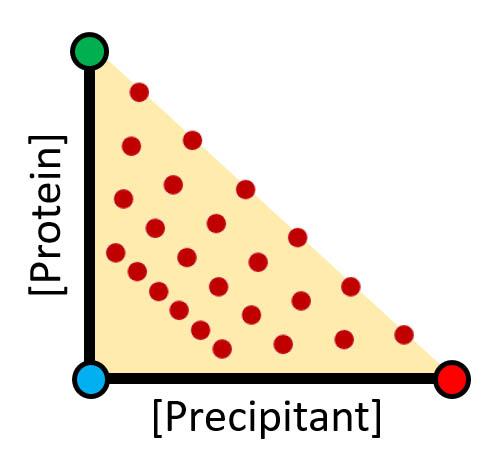
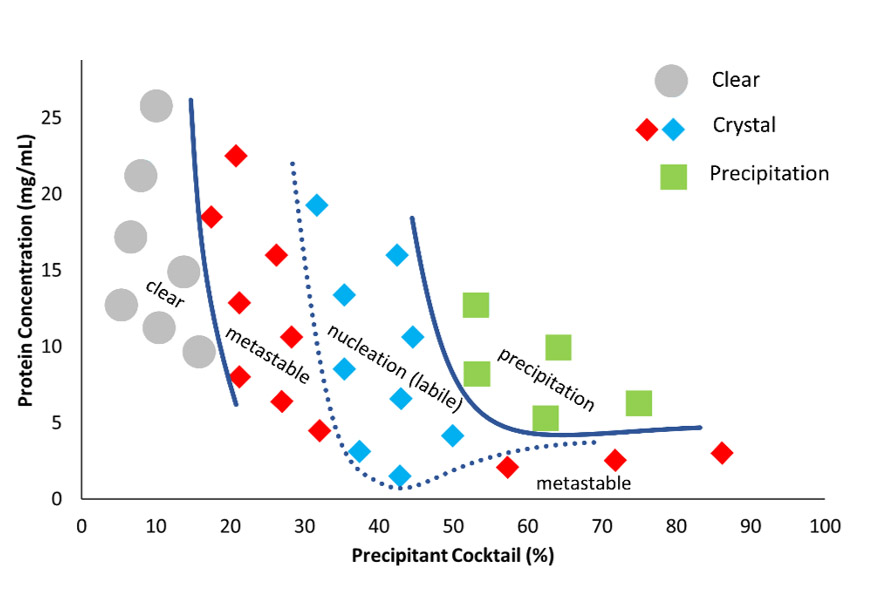
IntroductionAutomated phase diagram optimization is a useful tool for establishing the phase diagram for your protein. This is particularly beneficial for advanced techniques such a serial data collection, MicroED and Neutron diffraction where there is often a need for very consistent and well-defined samples. In the experiment, typically 3 ingredients are mixed using a multi-bore microtip (protein, precipitant cocktail and water). Seed stock can be added as a fourth ingredient, or it can be added to the cocktail. By mixing protein (green), precipitant cocktail (red) and water (blue), all points in the yellow triangle (below) can be reached, including areas of the phase diagram that are often overlooked such as very high protein or precipitant concentration.
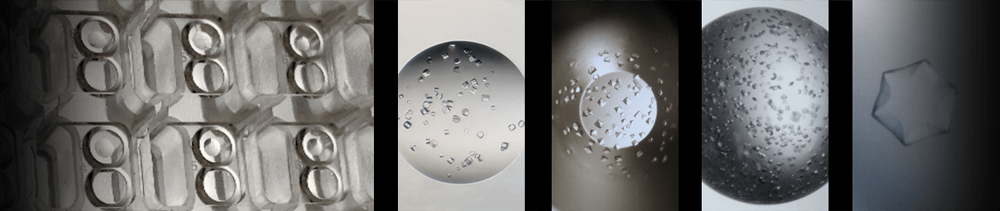
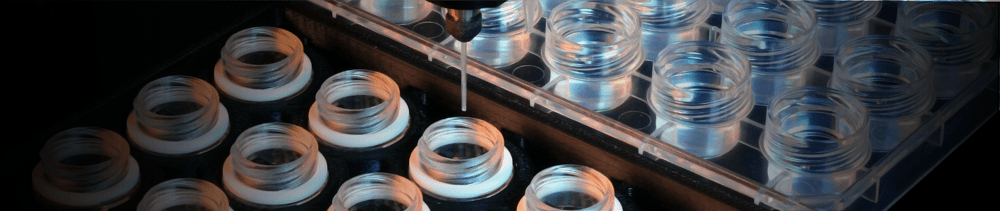
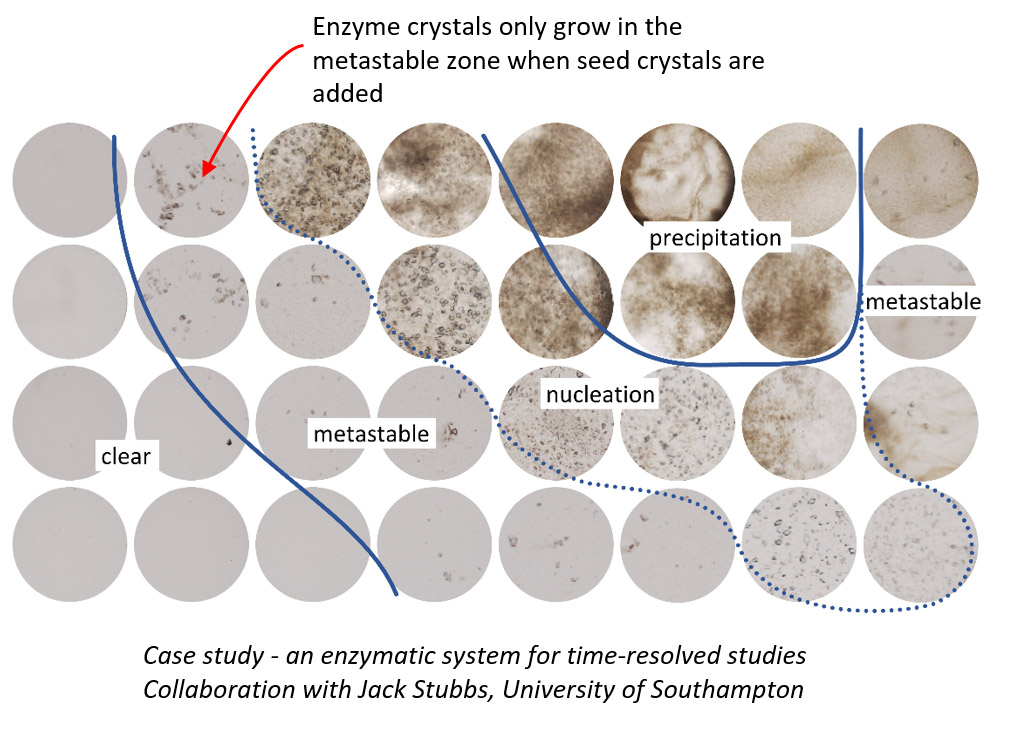
The experiments are dispensed using the microbatch-under-oil method. The drop is dispensed to a Vapor Batch plate then immediately covered with paraffin oil by the robot. The oil prevents evaporation from the drop, making it possible to accurately establish the phase diagram as the final concentration is known. It also makes it easier to scale up to larger batch volumes. The robot can be used to dispense to PCR tubes to prepare samples for data collection. VideoWatch to video to see the phase diagram optimization experiment in action: Case Study 1The example below is a case study of an enzymatic system that was a target for time resolved studies. The phase diagram experiment was used to establish the phase diagram and identify conditions for data collection.
The same experiment was dispensed with and without microseeding. This allowed the metastable zone to be identified, along with other regions of the phase diagram. Often the results are not what one would expect, for instance in this case (above) there are two metastable regions.
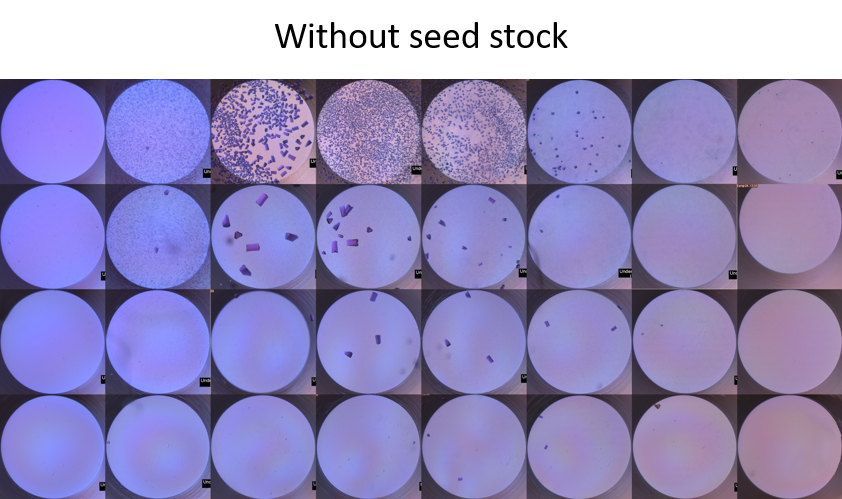
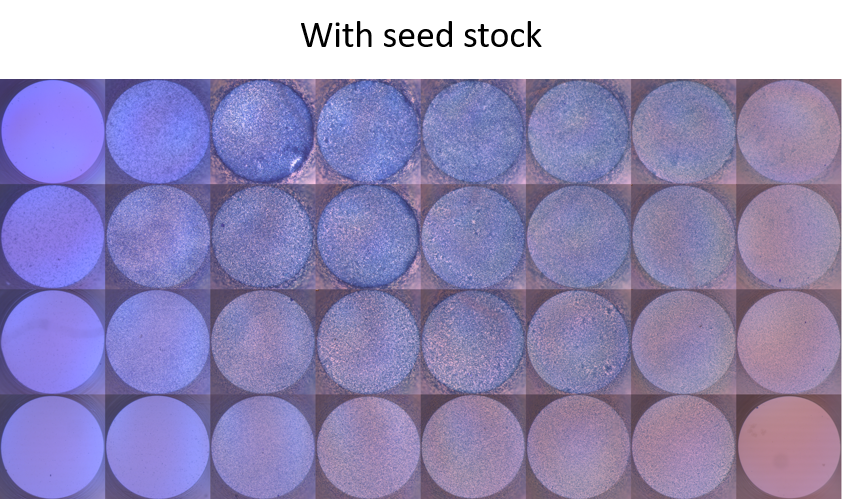
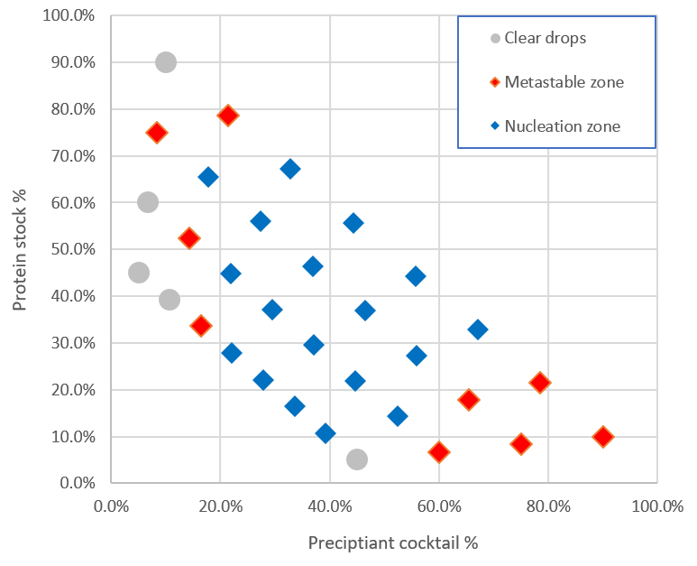
Case Study 2The example below is a case study of a bacterial photosynthetic protein.
The same experiment was dispensed with seeds and without seed stock allowing the metastable zone of the phase diagram to be identified ahead of further optimization.
Paper
"Automated microbatch-under-oil phase diagrams to rationalize serial crystallography sample preparation"
|